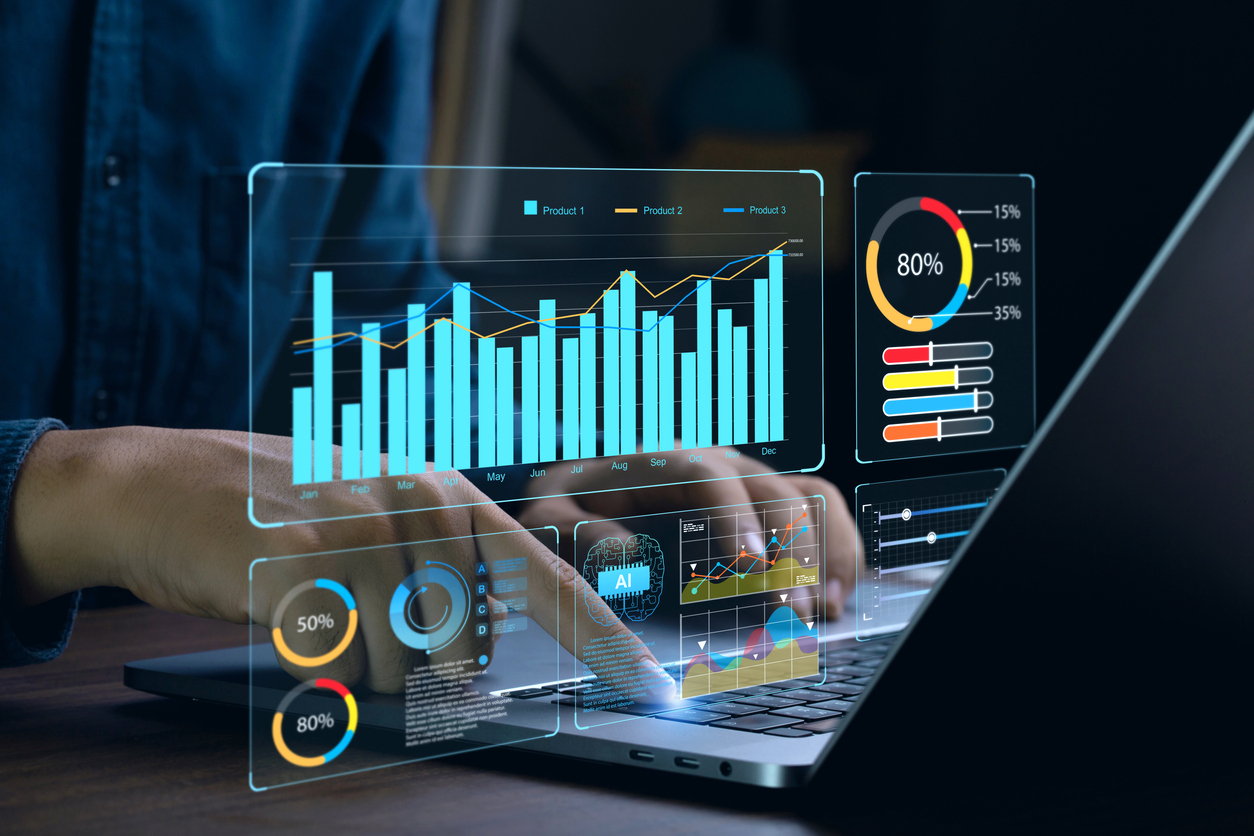
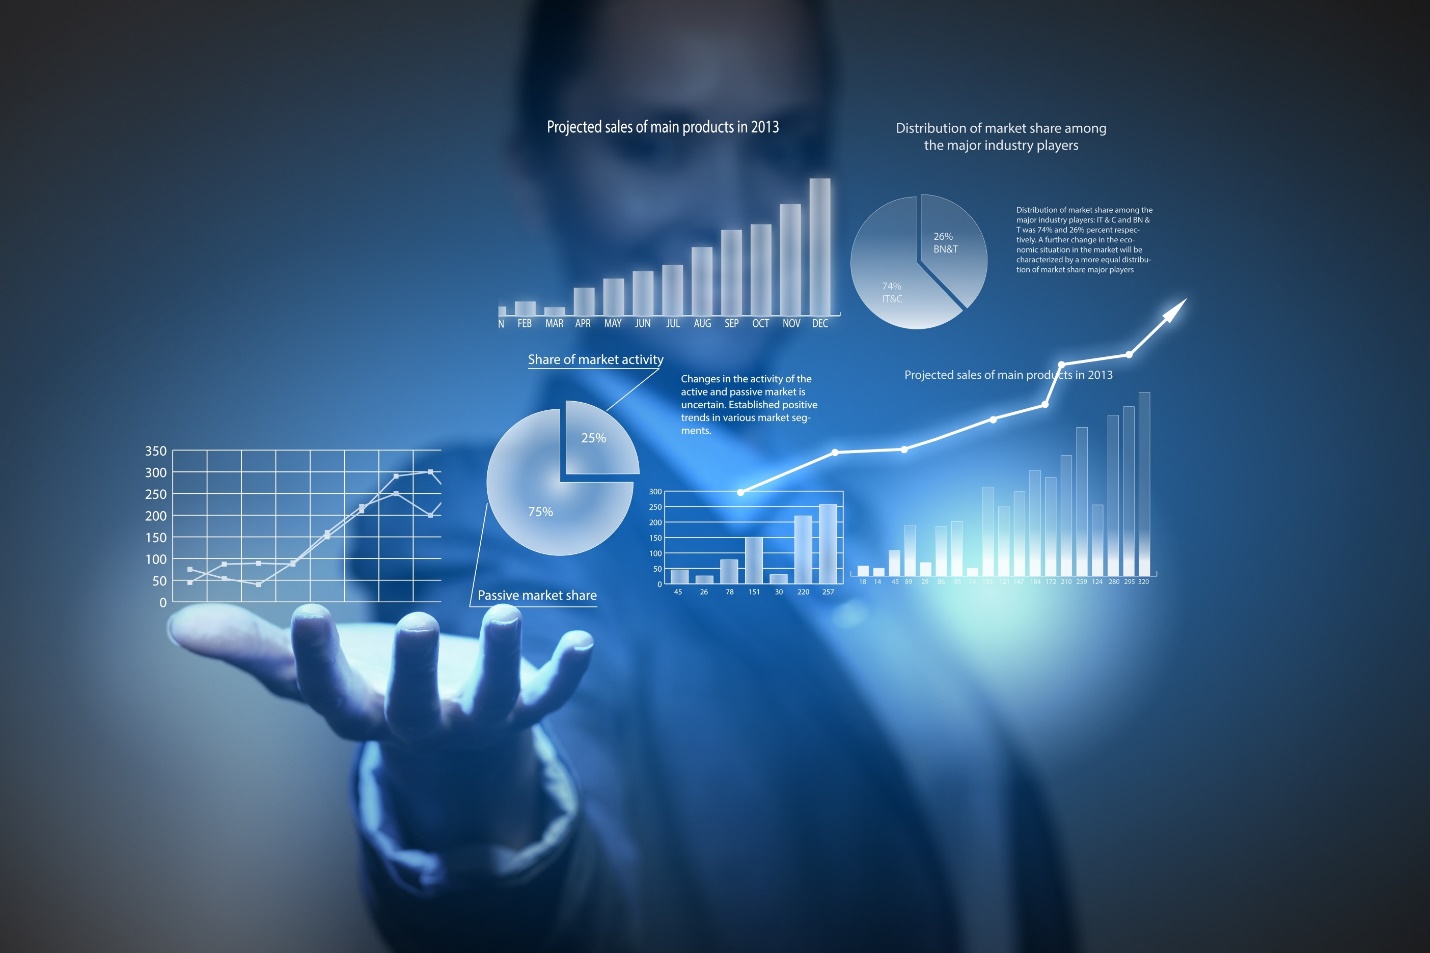
Advanced Data Analytics Dashboard for Real-Time Insights

  • Advanced Data Analytics Dashboard for Real-Time Insights

    In today’s data-centric world, every decision counts — and every second matters. Businesses that can analyze, interpret, and act on data in real-time have an undeniable edge. Yet, most organizations struggle with fragmented data, outdated reports, and delayed insights that limit their ability to respond to opportunities and risks.

    Our Advanced Data Analytics Dashboard for Real-Time Insights bridges that gap by offering a unified, intelligent, and dynamic platform that transforms complex data streams into actionable intelligence. Whether you’re tracking customer engagement, financial performance, or operational efficiency, our analytics dashboards empower you to make faster, smarter, and more confident business decisions.


    Real-Time Analytics Command Center Dashboard
  • Project Overview

    Why Real-Time Analytics Matters

    Traditional data reporting is reactive — it tells you what already happened. But in a fast-paced digital ecosystem, what businesses truly need is foresight.

    Real-time analytics enables organizations to see what’s happening now, predict what’s coming next, and respond proactively. From monitoring live transactions to detecting performance anomalies, real-time dashboards empower decision-makers with instant, actionable insights that drive agility and competitiveness.

    By consolidating data from multiple sources — CRMs, ERPs, IoT devices, marketing tools, and databases — our platform transforms raw data into intuitive visualizations and predictive models that guide better strategy and execution.

  • Our Approach to Building Intelligent Dashboards

    We design analytics solutions that are not just dashboards, but strategic command centers for business intelligence. Each project begins with a deep understanding of your data ecosystem, KPIs, and operational goals.


    Step 1: Discovery & Data Assessment

    We begin with a comprehensive analysis of your existing data systems, identifying key metrics, data sources, and integration points. Our experts work with your teams to understand business challenges and define measurable goals.

    Step 2: Architecture & Design Blueprint

    Our architects then design a data flow model that ensures scalability, accuracy, and speed. Whether hosted on the cloud or hybrid infrastructure, we build dashboards that integrate seamlessly with APIs, databases, and third-party platforms.

    Step 3: Data Integration & ETL Automation

    We automate data collection, cleansing, and transformation processes (ETL) to ensure accuracy and consistency. This enables a single, unified source of truth for all users across departments.

    Step 4: Real-Time Analytics & Visualization Development

    Using advanced analytics tools and AI algorithms, we create real-time dashboards with interactive charts, KPIs, heatmaps, and predictive visualizations that make data easy to explore and act upon.

    Step 5: Machine Learning & Predictive Intelligence

    We integrate AI and ML models that detect trends, forecast outcomes, and recommend data-driven actions. From sales forecasting to anomaly detection, your dashboard evolves with every interaction.

    Step 6: Security, Compliance, and Governance

    Data security is at the heart of our solutions. Our dashboards adhere to industry standards like GDPR, ISO 27001, SOC 2, and ensure role-based access controls for different departments.

    Step 7: Continuous Support & Optimization

    Post-deployment, we continuously monitor performance, optimize queries, and enhance visualization features as your business grows and new data sources emerge.

  • Core Features of Our Advanced Analytics Dashboards

    Real-Time Data Processing:
    Stream, analyze, and visualize live data from multiple sources instantly.

    Interactive Visualization:
    Dynamic charts, maps, KPIs, and drill-down reports simplify complex insights.

    AI-Powered Forecasting:
    Predict trends, customer behavior, and business outcomes using machine learning models.

    Customizable Dashboards:
    Fully tailored views for executives, analysts, and department heads.

    Automated Alerts & Anomaly Detection:
    Get real-time notifications when data crosses thresholds or trends deviate.

    Multi-Device Accessibility:
    Access dashboards securely from any device — desktop, tablet, or mobile.

    Data Security & Compliance:
    Built with encryption, user access controls, and compliance frameworks.

    Cloud & On-Premise Integration:
    Works seamlessly with AWS, Azure, Google Cloud, and hybrid setups.

  • Key Business Benefits

    Accelerate Decision-Making

    Access real-time performance data without delays.

    Enhance Operational Efficiency

    Identify bottlenecks and optimize workflows instantly.

    Reduce Costs

    Detect inefficiencies and cut waste with precision analytics.

    Strengthen Customer Experience

    Anticipate needs and personalize interactions.

    Boost Transparency

    Enable cross-departmental visibility with unified reporting.

    Drive Growth

    Use predictive intelligence to forecast demand and plan strategically.

  • Interactive KPI Dashboard with Live Metrics
    AI-Powered Predictive Analytics View
    Global Real-Time Data Command Center
  • Future-Ready IT Solutions for Every Industry

    Every industry generates data differently — but the need for real-time visibility and predictive insights is universal. Our analytics dashboards are fully adaptable to your sector’s needs, ensuring tailored intelligence and measurable outcomes.

  • Retail & E-Commerce

    Retailers thrive on understanding customer behavior and optimizing operations. Our dashboards track:


    Real-time sales and inventory levels.
    Customer journey analytics and conversion funnels.
    Seasonal trend forecasting and pricing optimization.

    Impact: Improved demand forecasting, reduced overstocking, and personalized marketing.

  • Banking & Financial Services

    Financial institutions rely on instant visibility for compliance and decision-making. Our dashboards enable:


    Live tracking of financial transactions and risk indicators.
    Predictive fraud detection using machine learning.
    Portfolio performance and market trend visualization.

    Impact: Enhanced compliance, reduced risk, and faster investment decisions.

  • Healthcare & Life Sciences

    In healthcare, real-time insights can save lives. Our analytics systems monitor:


    Patient data, treatment outcomes, and hospital operations.
    Predictive diagnostics using AI algorithms.
    Compliance dashboards for HIPAA and global standards.

    Impact: Streamlined care delivery, data-driven diagnosis, and improved patient outcomes.

  • Manufacturing & Supply Chain

    Manufacturers need continuous visibility into production efficiency and logistics. We help them track:


    Equipment performance and predictive maintenance.
    Supply chain visibility and real-time inventory updates.
    Demand forecasting and production analytics.

    Impact: Reduced downtime, higher productivity, and cost optimization.

  • Education & Research

    Educational institutions and research organizations benefit from:


    Enrollment trends and performance analytics.
    Funding utilization and research progress tracking.
    Predictive student performance dashboards.

    Impact: Improved resource allocation, student engagement, and institutional success.

  • Energy & Utilities

    Energy companies face the challenge of managing massive data from sensors and grids. Our dashboards provide:


    Real-time energy consumption analytics.
    Predictive maintenance for infrastructure.
    Environmental impact and sustainability tracking.

    Impact: Greater efficiency, reduced waste, and improved sustainability compliance.

  • Logistics & Transportation

    For logistics companies, time and data accuracy are everything. We provide:


    Fleet performance and fuel efficiency monitoring.
    Predictive delivery analytics and route optimization.
    Real-time tracking of shipments and assets.

    Impact: Faster deliveries, lower costs, and enhanced customer transparency.

  • Case Study: Real-Time Analytics Transformation for a Global Enterprise

    Client Background
    A multinational consumer goods company managing sales across 20+ countries faced challenges with data fragmentation.
    Each regional office maintained separate databases, making it difficult to gain a unified view of sales, operations, and inventory. Reports took weeks to compile, and decisions were often delayed by outdated data.


    Challenges


    Disparate data sources across continents.
    No real-time visibility of KPIs.
    Manual reporting processes prone to errors.
    Limited predictive capabilities for demand and performance trends.

    The company needed a unified, real-time analytics dashboard that could bring all global data together under one intelligent interface.


    Our Solution
    Our team implemented an Advanced Data Analytics Dashboard integrating multiple data sources — ERP, CRM, and POS systems — into a single cloud-based platform.


    Key Actions Taken:

    1. Data Integration & Cleansing: Unified 25+ regional data sources using automated ETL pipelines.
    2. Cloud Architecture: Deployed a multi-region architecture using AWS Redshift for global scalability.
    3. Real-Time Visualization: Built executive dashboards using Power BI and custom APIs for live updates.
    4. Predictive Analytics: Implemented machine learning models for demand forecasting and sales trend analysis.
    5. Automated Reporting: Introduced automated reporting workflows, reducing manual effort by 90%.

    Results Achieved


    Global Data Visibility: Centralized analytics enabled instant access to performance metrics across all regions.
    Time Savings: Reporting time reduced from 10 days to real-time access.
    Operational Efficiency: 35% improvement in inventory turnover and cost savings of 25%.
    Forecast Accuracy: Predictive models achieved 95% accuracy in sales trend forecasting.
    Empowered Leadership: Executives could make informed, proactive decisions using real-time insights.
  • Key Takeaways

    Real-time analytics is not a luxury — it’s a strategic necessity.
    Cloud-based dashboards provide scalability and security for global operations.
    AI-driven insights transform data into a competitive advantage.
    A unified data ecosystem empowers faster, smarter, and more confident decision-making.
  • Conclusion: Turn Data into Actionable Intelligence

    In a rapidly evolving business landscape, data is your most valuable asset — but only if it’s actionable.

    Our Advanced Data Analytics Dashboard for Real-Time Insights helps you turn scattered information into strategic intelligence that drives performance, innovation, and growth.

    At Swayambhus, we combine AI, automation, and cloud technology to help enterprises move beyond traditional reporting toward predictive, adaptive, and intelligent decision-making.
    Whether you’re optimizing operations, understanding customers, or forecasting trends — your future decisions start with real-time insights today.

  • Go Back Top